Promo Depth, Elasticity & The Margin Tug-of-War: What 2.1M Price Observations Reveal
1. Executive Summary
Discount retailers widened average promo depth from –12% to –18% YoY (AU/NZ, Q1 2025). Shorter, deeper promos shift price elasticity curves—creating hidden risk for everyday-low-price strategies. We unpack three behavioral patterns and show how AI promo tracking can pre-empt margin leaks.
2. Methodology
Window: 1 Feb–30 Apr 2025.
Channels: 7 value retailers, 4 supermarkets, 3 pharmacy chains, 2 online pure-plays.
Data: 2.1M price observations, 54k SKUs; matched by Nesika at 99% accuracy.
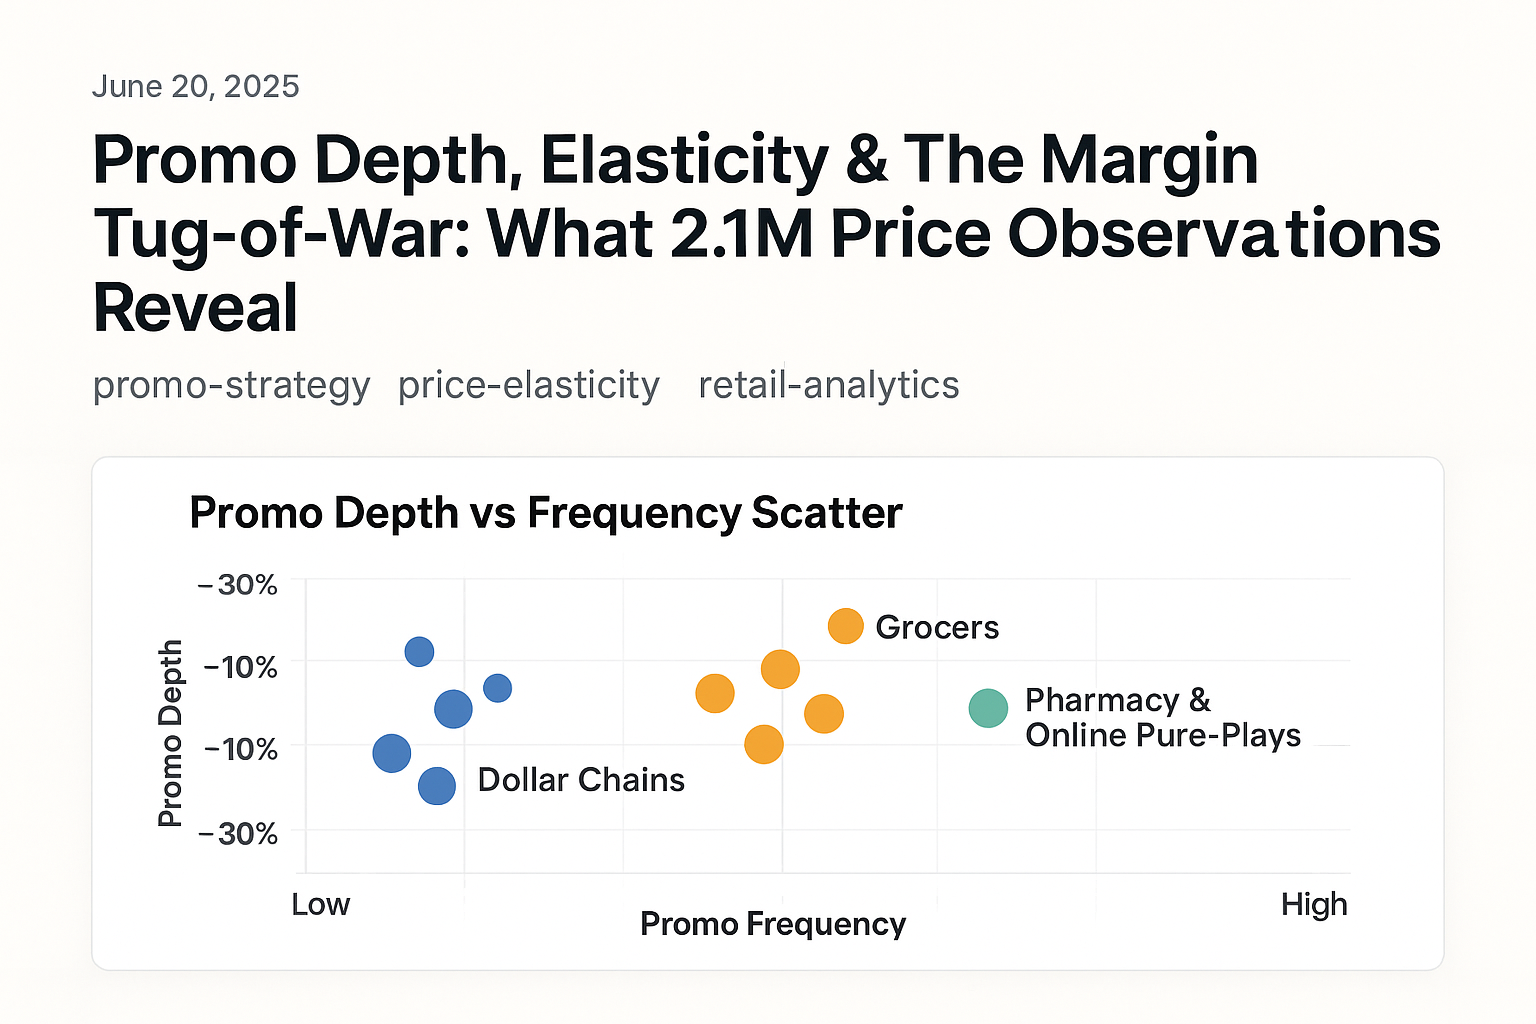
3. Promo Depth vs Frequency Scatter
Chart highlights: Dollar chains cluster at deep/short (–25% depth, 4-day median). Grocers cluster mid-depth but high frequency (–15%, 18-day on/off). Pharmacy & online pure-plays show narrow/deep long promos (beauty SKUs).
Insight call-outs: “High-low grocers create perceived discount without deeper unit cost, but cannibalise full-price weeks.”
4. Three Behavioral Patterns
4.1 “The Cliff-Drop” – Steep one-day flash, return to baseline. Example: 1L bleach SKU; unit sales +220%, but week-after dip below baseline (pantry loading).
4.2 “The Stagger” – 5-day step-down promo then hold new floor. Discounters use to reset psychological price point.
4.3 “The Elastic Strangle” – Companion promo (detergent + softener) drives cross-elasticity; margin neutral but basket lift +14%.
5. Elasticity Calculation (Quick Primer)
Log-log model: ΔQ/Q = ε × ΔP/P.
Nesika auto-fits curve from 6-month price/volume history; pushes “sweet-spot” suggestion.
Example: ε = –1.6 for 500g instant coffee; optimal promo depth –18% vs average –25% (over-discounting by 7 ppt).
6. Detecting Stealth Promos with NLP
Retailers often tag promos with CSS ribbons, not HTML schema.
Nesika’s computer-vision detects “deal”, “special”, color badges; adds Promo Flag even when price unchanged (bundle deals, multi-buys).
7. Action Framework for Pricing Teams
| Step | Tool | Metric |
|---|---|---|
| Hourly Promo Pulse | Nesika Price API | Price change alerts |
| Elasticity Overlay | Ask Nesika prompt | Optimal depth suggestion |
| Promo War-Room | Dashboard share to Slack | At-risk margin (A$) |
8. From Data to Negotiation
Show suppliers “promo overlap heat-map” to demand co-op funds.
Use Nesika’s 24-month vault to prove historical compliance vs policy.
9. Conclusion & Outlook
Expect average promo depth to tighten in H2 2025 as cost inflation eases. AI promo tracking + elasticity modelling wins the tug-of-war without race-to-the-bottom discounts.