Private-Label vs National Brands: Price Parity in the Age of Comparable Matches
1. Setting the Scene
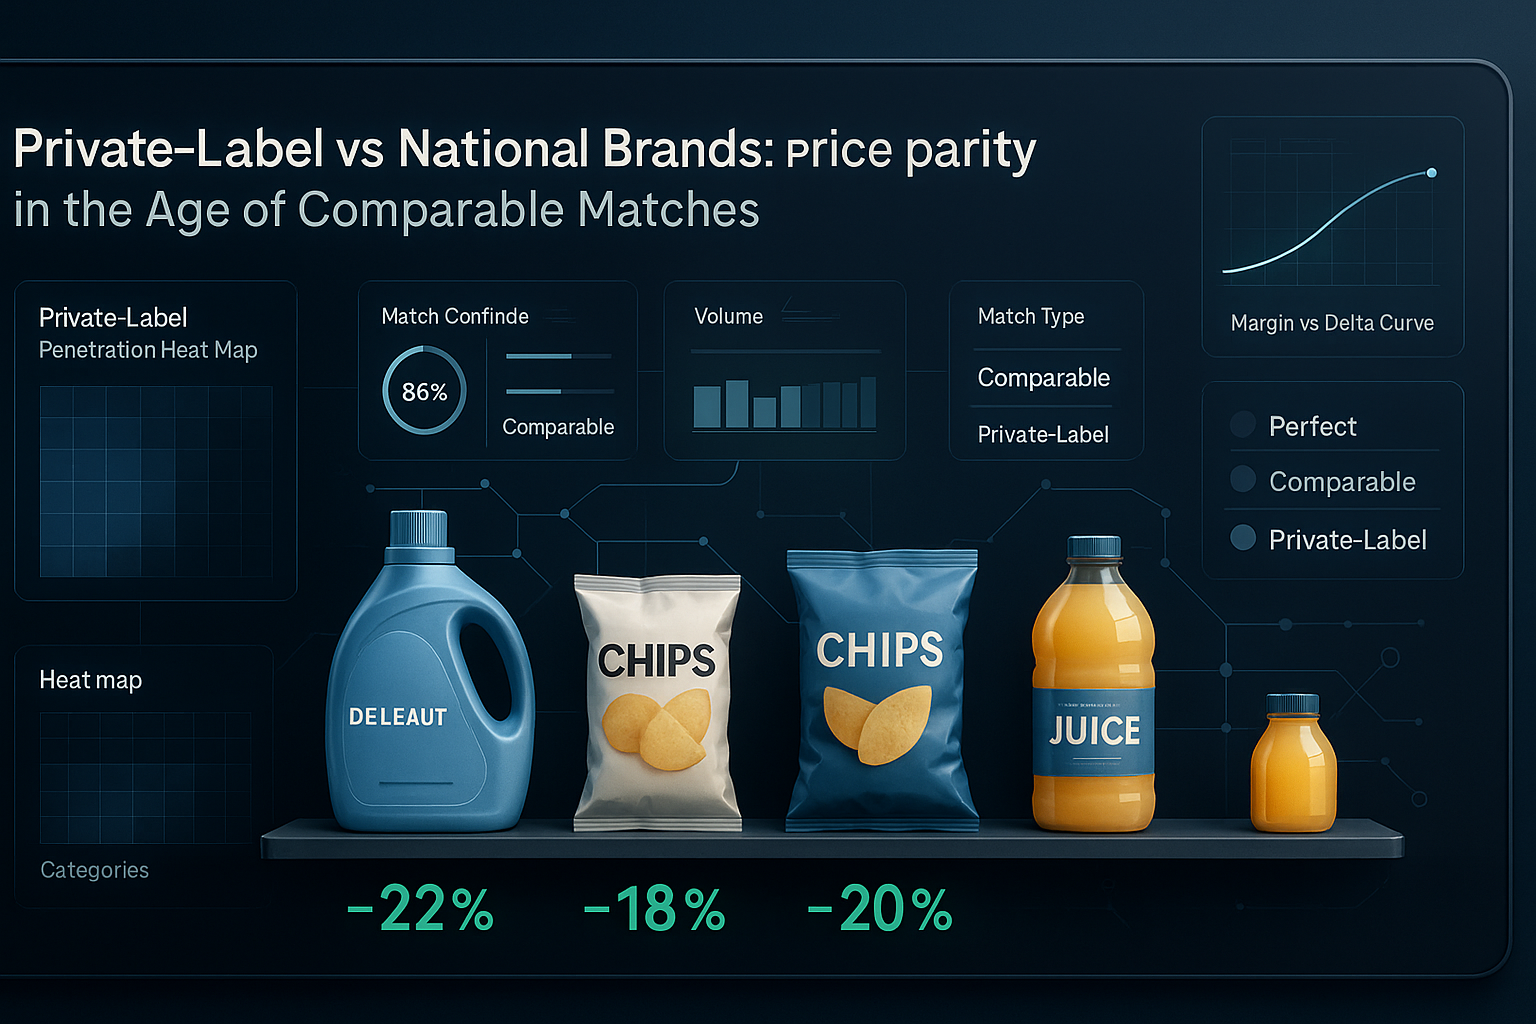
Private-label share hit 38% in AU discount retail (IRI, Mar 2025). Comparable matching shows private-label now at average –22% price delta vs brand nationals—narrowing from –30% in 2023. Brands must rethink promo & pack-size tactics; retailers must monitor own-label cannibalisation.
2. Match-Class Definitions
| Class | Logic | Buyer Relevance |
|---|---|---|
| Perfect | Same brand + size | National-brand price wars |
| Comparable | Different brand, same variant & size | Private-label parity |
| Private-Label | Retailer brand matches national spec | Cannibalisation watch |
Nesika auto-labels each with confidence score; strategy dashboards pivot around these classes.
3. Private-Label Penetration Heat-Map
Graph — categories vs share of search; high penetration in paper goods, snacks, frozen.
Observation: categories with high share-of-search for private-label see search rank parity within 3 months of launch.
4. Three Brand Playbooks Against Private-Label
Size Shift — move to odd sizes (375g) making A$ per 100g comparison harder.
Ingredient Plus — add functional differentiators (vitamin-C juice) to escape direct match.
Promo Disrupt — deep but short “parity blasts” to reclaim price perception.
AI detection: Nesika flags new comparable entrants <24h after launch → alerts brand teams.
5. Retailer Perspective: Own-Label Pricing Windows
Case from Nesika benchmark: Launch Week: price delta –28%. Week 4: delta tightens to –18% after first brand promo. Week 8: opt for price ladder (standard, premium, eco) to widen spread again.
Recommendation: monitor delta dispersion to keep ladder intact.
6. Impact on Gross Margin & Basket Size
Basket analysis shows shoppers swapping to private-label move 8% more units (due to saved dollars).
Net margin gain still +2 ppt for retailer despite lower price due to private-label COGS advantage.
Chart example: Margin vs Delta curve crosses at –24% optimum.
7. AI Match Engine Guardrails
Avoid false positives: title token “original” vs “original scent” leads to 0.8 sim; CV rescues by bottle color & shape.
QA team reviews any national→private-label match above revenue threshold.
8. Forecast: The Comparable Arms Race
Expect brands to lean into value-added pack sizes and functional claims.
Retailers will deploy AI dynamic pricing to keep own-label 18–22% below national average automatically.
9. Action Checklist for 2025 H2
| Stakeholder | Next Step |
|---|---|
| Brand | Build alternate pack SKUs for top 5 vulnerable products |
| Retailer | Use Nesika delta trigger to auto-reprice private-label ladder |
| Both | Monitor shrink-flation to keep like-for-like honest |
Try Nesika’s Comparable-Match Sandbox — Upload 100 SKUs, see your private-label deltas in 30 sec.
Try Sandbox →